From Łukasz Graczykowski
Exercise
Statistical hypotheses testing (5 pkt.)
- The experiment of irradiating a hydrogen bubble chamber with a beam of photons was carried out in order to study the interaction of photons with protons. Photons create electron-positron pairs that can be used to monitor the photon beam. The frequency of images with 0,1,2, ... electron-positron pairs should follow the Poisson distribution. Data should be read from the file (the first column shows the number of electron pairs in the image
k, and the second column shows the number of photos containing k electron pairs). We can see that this distribution resembles the Poisson distribution - therefore we are trying to calculate the maximum likelihood estimator for the parameters of the Poisson distribution (see Lecture 10) (1 pkt.)
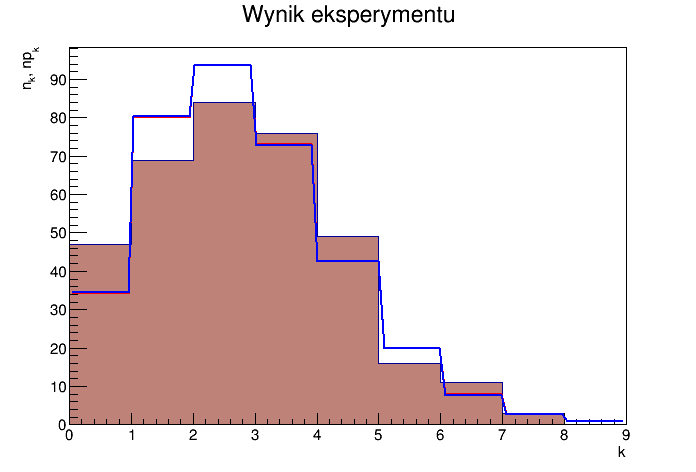
- Narysować na jednym wykresie punkty pomiarowe i dopasowanie (metodą estymatora największej wiarygodności i funkcją Fit z ROOT'a użytą z parametrami "LR" - dopasowanie metodą największej wiarygodności). Funkcja TF1 do rysowania (i dopasowania ROOT'em) to TMath::PoissonI (1 pkt.)
- Check the quality of the fit with the χ2 test. For this purpose, a function for calculating the χ2 test statistic should be implemented according to the formul
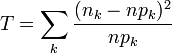
where: nk - number of observations in the kth bin, npk - the number of cases predicted by the theory in the kth bin, i.e .:
// h - data histogram
// g - "theoretical" prediction
double chi2(TH1D *h, TF1 *f);
- Determine the number of degrees of freedom and calculate the value of the test statistic. (1 pt)
- Implement a function that returns the result of the χ2 test at a given significance level α, i.e .:
 // true - there is no reason to reject the hypothesis
 // false - there are grounds for rejecting the hypothesis
 // Parameters:
 // T - value of the chi2 test statistic
 // alpha - significance level
 // ndf - the number of degrees of freedom of chi2 distribution
bool testChi2(double T, double alpha, int ndf);
Using the implemented function, verify the hypothesis that the measurement data are subject to the Poisson distribution. Select the appropriate value for the significance level. Warning! Kwanyl can be read from the distribution box counted in the last class. (2 pts)
Attention
- Our task is to manually carry out the actions performed automatically by the
Fit function.
- The problem consists of two parts: determining the parameter of the Poisson distribution by the maximum likelihood method, looking for the estimator with the lowest variance. So we read: Lecture 10 link - about the maximum likelihood method for Poissonian distribution
- The likelihood function is, in general, a probability distribution function for the parameters of the analyzed distribution, determined on the basis of a random sample (if, for example, we study the growth distribution of Poles f (x), where X is a random variable determining the height of Poles, e.g. Gaussian distribution with two parameters (mean, deviation), then L will be the likelihood function, probability distribution of the parameters of the mean and deviation -> we are looking for the maximum of the L function, which will give us the most reliable values of the parameters mean and deviation of the function f (x))
- Searching for parameters using the maximum likelihood method consists in solving the likelihood equations, which are nothing more than the conditions necessary for the existence of the maximum of the L function (according to the mathematical analysis - we calculate the appropriate derivatives)
- For the Poisson distribution, the estimator with the lowest variance obtained by the maximum likelihood method results from the solution of the likelihood equation (one equation, because one Lambda parameter) KADD2022 / Wyklad10-2022.pdf link
- The second part, after finding the estimator with the highest likelihood, is to perform a chi-square test. For this purpose, we read carefully Lecture 10
- There are two lines in the graph below (histogram) - blue and red. One is an auto-fit with
Fit , the other is a manual procedure described above.
- For the Poisson distribution in the form of such "steps" we use the function
TMath :: PoissonI (link)
- The quantile of the chi-square distribution with the appropriate number of degrees of freedom to perform the test can be read from Exercise 9 (previous classes) - that is why we drew these chi-square distributions last time.
Result
Output:
FCN=5.75356 FROM MIGRAD    STATUS=CONVERGED      29 CALLS          30 TOTAL
                    EDM=5.17016e-07    STRATEGY= 1      ERROR MATRIX ACCURATE
 EXT PARAMETER                                   STEP         FIRST
 NO.   NAME      VALUE            ERROR          SIZE      DERIVATIVE
  1  p0           3.55268e+02   1.88558e+01   3.25727e-02   3.68816e-05
  2  p1           2.33737e+00   8.17264e-02   1.40382e-04  -2.26405e-03
                              ERR DEF= 0.5

Lambda of the highest likelihood: 2.33239
Lambda (ROOT Fit): 2.33737
chi2 (value of the test statistics T): 10.5336
chi2/NDF: 1.7556
chi2 (ROOT Fit): 9.85507
chi2 (ROOT Fit)/NDF: 1.40787
Significance level alpha: 0.01
Test result: no grounds to reject the null hypothesis

