From Łukasz Graczykowski
(Difference between revisions)
|
|
| Line 10: |
Line 10: |
| | * documentation of the laboratory version (5.32.00): [https://root.cern.ch/root/html532/ https://root.cern.ch/root/html532/] last version with the old C++ interpreter | | * documentation of the laboratory version (5.32.00): [https://root.cern.ch/root/html532/ https://root.cern.ch/root/html532/] last version with the old C++ interpreter |
| | | | |
| - | == Zadanie == | + | == Exercise == |
| - | 1. Należy napisać makro, które: | + | 1. Write a macro, which: |
| - | * tworzy obiekt <code>fun1</code> typu <code>TF1</code> reprezentujący funkcję <code>sin(x)</code> (patrz klasa <code>TMath</code>) | + | * creates an object <code>fun1</code> of type <code>TF1</code> representing a <code>sin(x)</code> function (see class <code>TMath</code>) |
| - | * tworzy obiekt <code>fun2</code> typu <code>TF1</code> reprezentujący funkcję <code>cos(x)</code> | + | * creates an object <code>fun2</code> of type <code>TF1</code> representing a <code>cos(x)</code> function |
| - | * tworzy okno z 4 panelami (rozkład paneli 2x2) - patrz klasa <code>TCanvas</code> i metoda <code>Divide</code> | + | * creates a window with 4 panels (panel distribution 2x2) - see class <code>TCanvas</code> and method <code>Divide</code> |
| - | * rysuje obiekt <code>fun1</code> na 1 panelu, <code>fun2</code> na 2 panelu, oraz obie funkcje jednocześnie na 3 panelu | + | * draws the <code>fun1</code> object on panel 1, <code>fun2</code> on panel 2, and two functions simultaneously on panel 3 |
| - | * zmieni kolor linii funkcji <code>fun2</code> na niebieski - patrz metoda <code>SetLineColor</code> i klasa <code>TColor</code> | + | * changes the color of the line of function <code>fun2</code> to blue - see method <code>SetLineColor</code> and class <code>TColor</code> |
| | <br> | | <br> |
| - | 2. Wyobraźmy sobie, że rzucamy niesymetryczną sześcienną kostką do gry. Wyniki podsumowuje poniższa tabelka: | + | 2. Let's imagine we throw a dice that is asymmetric. The table below summarizes the results: |
| | {| class="wikitable" border="1" | | {| class="wikitable" border="1" |
| | |- | | |- |
| - | ! Ilość oczek | + | ! Number of pips |
| | | 1 | | | 1 |
| | | 2 | | | 2 |
| Line 29: |
Line 29: |
| | | 6 | | | 6 |
| | |- | | |- |
| - | ! Ilość rzutów | + | ! Number of throws |
| | | 2 | | | 2 |
| | | 1 | | | 1 |
| Line 37: |
Line 37: |
| | | 12 | | | 12 |
| | |} | | |} |
| - | Modyfikujemy dalej makro:
| + | We modify further the macro: |
| - | * tworzymy histogram (patrz klasa <code>TH1D</code>) wypełniając kolejne biny (odpowiadające kolejnym ilościom oczek) wartościami z tabelki (ilość rzutów) - histogram należy narysować na panelu 4 | + | * let's create a histogram (see class <code>TH1D</code>) by filling each bin (which corresponds to each dice facet) with values from the table (number of throws) - the histogram should be plotted on panel 4 |
| - | * należy stworzyć wykres - graf (patrz klasa <code>TGraph</code>) zgodnie z wartościami z tabelki. | + | * create a plot, called graph (see class <code>TGraph</code>) according to values from the table. |
| - | * zmienić styl punktów grafu na kółko (patrz metoda <code>SetMarkerStyle</code> oraz klasa <code>TAttMarker</code>) | + | * change the style of graph points (see method <code>SetMarkerStyle</code> and class <code>TAttMarker</code>) |
| - | * narysować graf w oddzielnym oknie | + | * draw the graph in a separate window |
| | | | |
| | == Uwagi == | | == Uwagi == |
Revision as of 12:40, 28 February 2022
Documentation
Documentation of the ROOT environment:
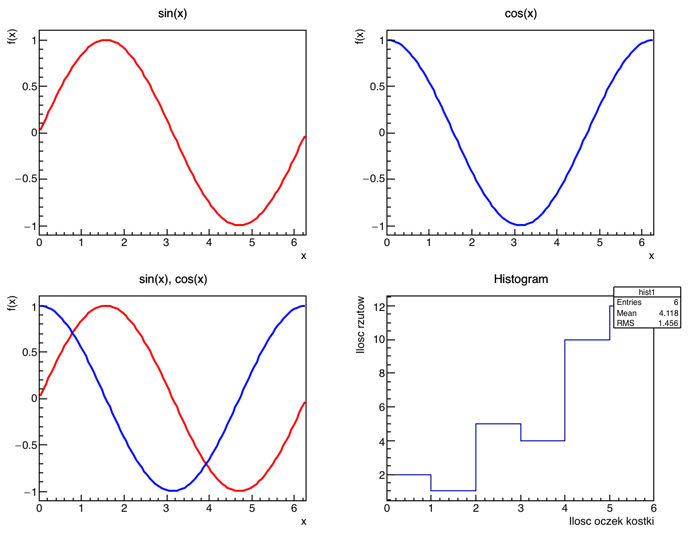
Exercise
1. Write a macro, which:
- creates an object
fun1 of type TF1 representing a sin(x) function (see class TMath)
- creates an object
fun2 of type TF1 representing a cos(x) function
- creates a window with 4 panels (panel distribution 2x2) - see class
TCanvas and method Divide
- draws the
fun1 object on panel 1, fun2 on panel 2, and two functions simultaneously on panel 3
- changes the color of the line of function
fun2 to blue - see method SetLineColor and class TColor
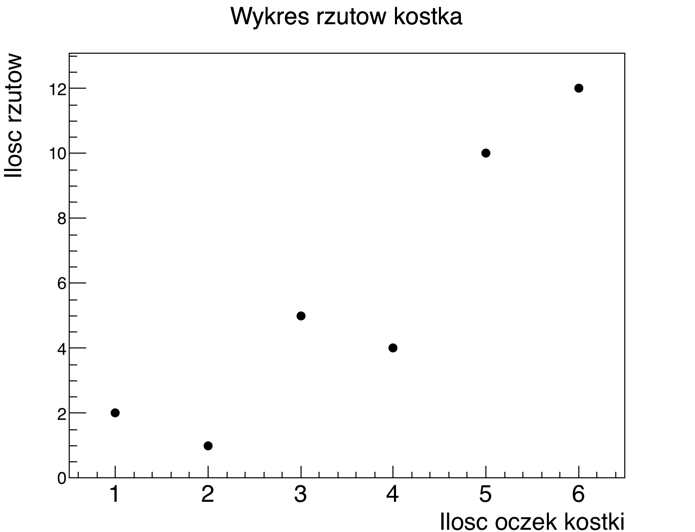
2. Let's imagine we throw a dice that is asymmetric. The table below summarizes the results:
| Number of pips
| 1
| 2
| 3
| 4
| 5
| 6
|
| Number of throws
| 2
| 1
| 5
| 4
| 10
| 12
|
We modify further the macro:
- let's create a histogram (see class
TH1D) by filling each bin (which corresponds to each dice facet) with values from the table (number of throws) - the histogram should be plotted on panel 4
- create a plot, called graph (see class
TGraph) according to values from the table.
- change the style of graph points (see method
SetMarkerStyle and class TAttMarker)
- draw the graph in a separate window
Uwagi
- Uwaga! Aby środowisko ROOT można było uruchomić na własnym koncie użytkownika w laboratorium, należy w pliku
$HOME/.bashrc dopisać następujące linijki (jeśli nie były dodane na zajęciach z PTI):
 export ROOTSYS=/opt/root
 export PATH=$PATH:$ROOTSYS/bin
 export LD_LIBRARY_PATH=$LD_LIBRARY_PATH:$ROOTSYS/lib
- środowisko ROOT jest zainstalowane lokalnie na każdym komputerze - nie jest dostępne na serwerze
- w środowisku ROOT piszemy makra, które mają rozszerzenie .c, .C, .cpp, lub .cxx
- makro zawiera w sobie kod w języku C++ interpretowany linijka po linijce
- w zasadzie nie musimy załączać żadnych bibliotek
- przykład 1:
{
    double x = 5;
    cout<<x<<endl;
}
- wywołanie makra: uruchamiamy środowisko (komenda
root), wpisujemy .x macro.C
- makro może zawierać również funkcje, przykład 2:
int macro()
{
    double x = 5;
    cout<<x<<endl;
    return 1;
}
- nazwa makra musi być taka sama jak nazwa funkcji w makrze (by można było je uruchomić komendą
.x macro.C)
- w makrach może być więcej funkcji - przy standardowym uruchomieniu wywołana zawsze będzie ta funkcja, której nazwa zgadza się z nazwą makra (odpowiednik funkcji
main w standardowym C++)
Wynik
Wykresy: