From Łukasz Graczykowski
(Difference between revisions)
|
|
| Line 6: |
Line 6: |
| | == Exercise == | | == Exercise == |
| | Measurements of three physical observables <code>X1, X2</code> oraz <code>X3</code> have been made. Results of the measurements are in the following files: | | Measurements of three physical observables <code>X1, X2</code> oraz <code>X3</code> have been made. Results of the measurements are in the following files: |
| - | [http://www.if.pw.edu.pl/~lgraczyk/wiki/images/e/ed/Dane1.dat Dane1.dat], [http://www.if.pw.edu.pl/~lgraczyk/wiki/images/0/0d/Dane2.dat Dane2.dat] oraz [http://www.if.pw.edu.pl/~lgraczyk/wiki/images/b/ba/Dane3.dat Dane3.dat]. | + | [http://www.if.pw.edu.pl/~lgraczyk/wiki/images/e/ed/Dane1.dat Dane1.dat], [http://www.if.pw.edu.pl/~lgraczyk/wiki/images/0/0d/Dane2.dat Dane2.dat] and [http://www.if.pw.edu.pl/~lgraczyk/wiki/images/b/ba/Dane3.dat Dane3.dat]. |
| | | | |
| | * Please calculate the result (mean and uncertainty - standard deviation) and draw the relation between the variables <code>(X1, X2)</code>, <code>(X2, X3)</code> and <code>(X1, X3)</code>. (1 pkt) | | * Please calculate the result (mean and uncertainty - standard deviation) and draw the relation between the variables <code>(X1, X2)</code>, <code>(X2, X3)</code> and <code>(X1, X3)</code>. (1 pkt) |
Latest revision as of 10:48, 28 March 2022
Exercise
Measurements of three physical observables X1, X2 oraz X3 have been made. Results of the measurements are in the following files:
Dane1.dat, Dane2.dat and Dane3.dat.
- Please calculate the result (mean and uncertainty - standard deviation) and draw the relation between the variables
(X1, X2), (X2, X3) and (X1, X3). (1 pkt)
Variables Y1, Y2 are related to X1, X2, X3 via the following formulas:
Y1 = 2 X1 + 5 X2 + X3
Y2 = 3 + 0.5 X1 + 4 X2
Please calculate:
- covariance matrix X1, X2, X3 (1 pkt)
- mean values of Y1, Y2 in direct measurement (0.5 pkt)
- covariance matrix Y1, Y2 (1pkt)
- uncertainties of quantitites Y1, Y2 (1 pkt)
- correlation coefficients Y1 and Y2 (0.5 pkt)
Attention
- Look carefully three first slides from lecture 5 link
- Szczegółowy opis slajdy 12-16 from lecture 4 link
- Read data from file (the same as in C++):
ifstream ifile;
ifile.open("dane.dat");
double val;
while(ifile>>val)
{
  cout<<val<<endl;
}
ifile.close();
- For all matrix operation (creating matrices of covariance, multiplication of matrices, transposing matrices) - use the class
TMatrixD link
- Remember, that matrix operations require correct order of matrices.
- Uncertainty and correlation coefficient of X we obtain from TH2D histograms after reading the data; uncertainties and correlation coefficient of Y we obtain after calculating the matrix of coviarance of Y
- Limits of the histogram ranges in T2DH histograms in my solution are as follows:
 double x1min = 1.5, x1max = 5.0;
 double x2min = 0.0, x2max = 3.0;
 double x3min = 4.0, x3max = 16.0;
 TH2D *h12 = new TH2D("h12","Hist12",100,x1min,x1max,100,x2min,x2max);
 TH2D *h13 = new TH2D("h13","Hist13",100,x1min,x1max,100,x3min,x3max);
 TH2D *h23 = new TH2D("h13","Hist23",100,x2min,x2max,100,x3min,x3max);
Results
Plots:
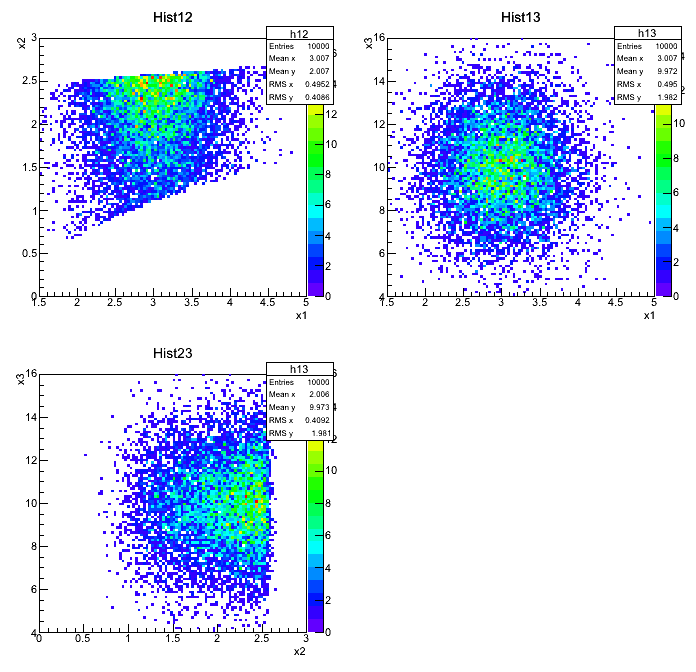
Output:
X1=3.00691, u(X1)=0.495242
X2=2.00581, u(X1)=0.40909
X3=9.97287, u(X3)=1.98102
rho(X1,X2)=0.156132
rho(X1,X3)=-0.00698853
rho(X2,X3)=0.00875851

after rounding to 2 significant digits:
X1=3.01, u(X1)=0.50
X2=2.01, u(X1)=0.41
X3=9.97, u(X3)=1.98

This is the matrix of covariance for X
3x3 matrix is as follows

     |      0    |      1    |      2    |
--------------------------------------------
   0 |     0.2453      0.0316   -0.006855
   1 |     0.0316      0.1674      0.0071
   2 |  -0.006855      0.0071       3.924

This is the matrix of covariance for Y
2x2 matrix is as follows

     |      0    |      1    |
-------------------------------
   0 |      9.765       3.949
   1 |      3.949       2.865

Y1=26.0157, u(Y1)=3.1249
Y2=12.5267, u(Y2)=1.6927404
rho(Y1,Y2)=0.746574
rho(Y2,Y1)=0.746574

after rounding to 2 significant digits:
Y1=26.02, u(Y1)=3.13
Y2=12.53, u(Y2)=1.70
