From Łukasz Graczykowski
(Difference between revisions)
Latest revision as of 12:23, 21 March 2022
Exercise
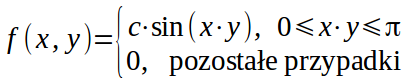
The following probability density function is given:
Please do:
- calculate constant c in the way the probability distribution is normalized
- randomly select from the probability distribution a pair of numbers (x,y) and then fill with the a histogram of the probability distribution f(x,y) (0.5pkt)
- normalize the histogram of the probability distribution (0.5pkt)
- calculate and draw the histogram of the cumulative distribution F(x,y) (1pkt)
- calculate and draw the histograms of the marginal distributions g(x) i h(y) (1pkt)
- calculate:
- expected values: E(X), E(Y) (0.5pkt)
- standard deviations sigma(X), sigma(Y) (0.5pkt)
- covariance cov(X,Y) (0.5pkt)
- correlation coefficient rho(X,Y) (0.5pkt)
Attention
- As minimum and maximum on x and y axed in all objects we set 0 and PI/2
- For work with histograms we used objects
TH1D and TH2D. Some examples can be found in: Histograms
- The histogram of the probability density we create by random selection of pseudorandom numbers from the probability density functions (we create a TF2 object like previous lab and we implement a loop until a certain number, for each iteration we use GetRandom2' to select those 2 numbers and then we use a function called Fill to fill the density histogram)
- Cumulative distribution is calculated numerically (two for loops, and we integrate the density iterating over x and y, by SetBinContent we set the specific valued of the histogram)
- Marginal distributions have their own methods for histograms (hint: they are called projections)
- For parameters (means, standard deviations, covariances, correlation factors) - there are specific methods
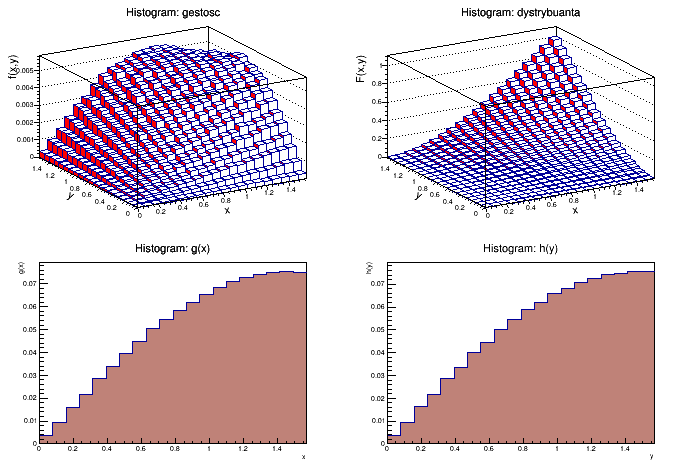
Result
Plots:
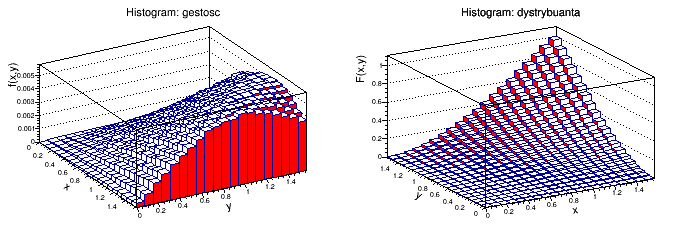
Rotated distribution:
Output:
E(X)=0.990827
E(Y)=0.990535
sigma(X)=0.377467
sigma(Y)=0.377583
cov(X,Y)=-0.0137694
rho(X,Y)=-0.09661


