From Łukasz Graczykowski
(Difference between revisions)
|
|
| Line 25: |
Line 25: |
| | | | |
| | Output: | | Output: |
| - | P(5<X<10) z gestosci: 0.245723 | + | P(5<X<10) from the density: 0.245723 |
| - | P(5<X<10) z dystrybuanty: 0.245723 | + | P(5<X<10) from the cumulative distribution: 0.245723 |
| - | Srednia z funkcji TF1: 5.98798 | + | Mean from the function TF1: 5.98798 |
| | | | |
| - | Srednia analitycznie: 6 | + | Mean analytically: 6 |
| - | Wariancja z funkcji TF1: 35.3988 | + | Variance from TF1: 35.3988 |
| - | Wariancja analitycznie: 36 | + | Variance analytically: 36 |
| - | Moda: 0 | + | Mode: 0 |
| | x0.25: 1.74 | | x0.25: 1.74 |
| | x0.5: 4.16 | | x0.5: 4.16 |
| | x0.75: 8.32 | | x0.75: 8.32 |
Latest revision as of 12:14, 7 March 2022
Zadanie
Let X be a random variable that has a probability distribution function f(x):

Please do:
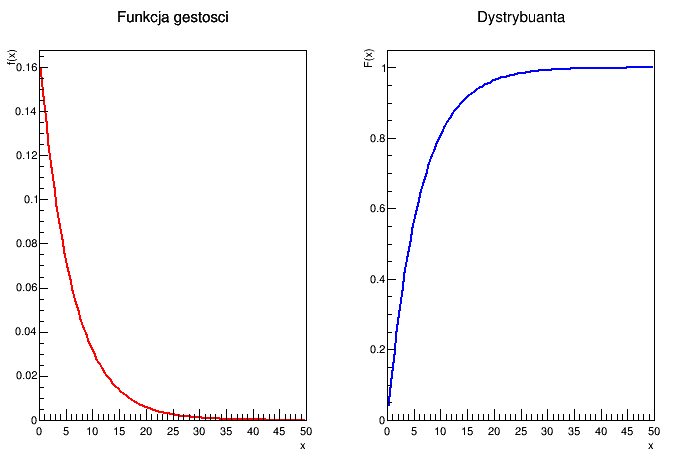
- Draw the probability distribution function f(x) (0.5 pkt)
- Draw the cumulative distribution F(x). Cumulative distribution has to be drawn numerically and analytically. (1 pkt)
- Calculate the probability P(5 <= X <= 10) (0.5 pkt)
- Calculate the expected value E(X) and compare with the analytic result (1 pkt)
- Calculate the variance V(X) and compare with the analytic result(1 pkt)
- Calculate mode (0.5 pkt)
- Calculate quantiles: (0.5 pkt)
- lower quartile
- median
- upper quartile
Results
Plots:
Output:
 P(5<X<10) from the density: 0.245723
 P(5<X<10) from the cumulative distribution: 0.245723
 Mean from the function TF1: 5.98798
 Mean analytically: 6
 Variance from TF1: 35.3988
 Variance analytically: 36
 Mode: 0
 x0.25: 1.74
 x0.5: 4.16
 x0.75: 8.32

