Agata Fronczak and Piotr Fronczak
Faculty of Physics, Warsaw University of Technology,
Koszykowa 75, PL-00-662 Warsaw, Poland
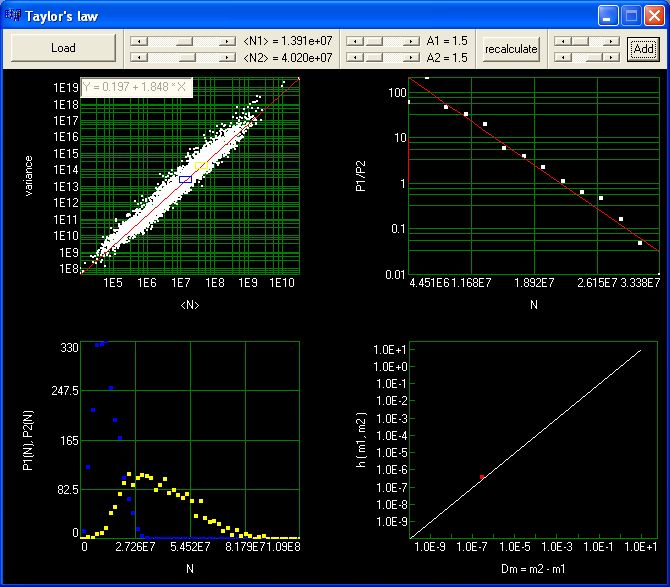
Here, we present an application which can be used for the analysis of different data sets according to the results of our paper [1]. The main window is shown below:
The best way to understand how the application works is to see it in action. In the following, we will validate our approach using two data sets containing information on traffic in transportation networks. Hourly numbers of cars passing through observation points located on inter-states, trunk highways, county state-aid highways, and municipal state-aid streets at various locations through out Minnesota were retrieved from the Minnesota Department of Transportation (for more detailed description please see [1]). First data set contains information collected from many traffic recorders without any distinction of day's time, the second one contains daily fluctuations in traffic measured by a single recorder in the mouring hours 1am-7am (please cf. fig. 1g and 1h in [1]).
First step is to load data using the "Load" button located in the upper left window's corner. The application accepts files with the ".txt" extension with the following format:
mean variance number_of_points point_1 [point_2 ...]
Please load the file all_atrs.txt. If the operation is successful the Taylor's law is plotted in the upper left panel, linear regression is performed and its result is shown in the upper left corner of the panel.
Next, using two scrollbars located right to the "Load" button, please select two regions from which two frequency distributions will be chosen for further analysis. The regions are marked by yellow and blue rectangles. For example, please set the first scrollbar to <N1> = 3.988e+02 and the second one to <N2> = 1.248e+03.
The next two scrollbars can be used for changing the sizes of these two rectangles, but for the reasons explained in [1] the current values are the most appropriate.
If the regions are already selected, please press "Recalculate" button. Two distributions P1(N) and P2(N) corresponding to the selected regions are drawn in the lower left panel. Their quotient is drawn in the upper right panel. If our theory is correct then the points in this panel should lie close to the straight line (the read line drawn in this panel is just a linear regression). In our example it is not true. The strange shape of the distribution in the lower left panel can suggest an explanation.
The reason is that although the bulk of the considered data fulfills Taylors law with a given parameter b, in fact, the data may consist of a certain number of subsets i = 1; 2; ... (e.g., representing logical subsystems of the considered system), each of which is characterized by its own characteristic parameter, bi.Careless selection of data may lead, as in our case, to misleading results. Therefore, in most cases, data standardization is required.
The second file named one_atr.txt contains much better filtered data. Please load it now and select two regions coresponding to means <N1> = 2.594e+00 and <N2> = 6.192e+00 respectively. Please press "Recalculate" button. Now, the fit in the upper right panel is much more convincing.
The last two scrollbars allow to limit the range of points used in linear regression. Sometimes one exterior point obviously distorts the linear fit and then it is worth to not include that point in regression.
Final step is to press "Add" button. Now the application performs the calculations of identity (19) from [1]. To this end the parameter b (from linear regression in the panel 1), means <N1> and <N2> (from adequate scrollbars) and the slope (from linear regression in the panel 3) are taken into account. If the identity (19) is correct then the resulting point should lie on the white line drawn in the panel 4.
Now you can experiment with different means <N1> and <N2> and with different data sets (also your own).
Here, you can download the application (Windows XP and higher).
Data sets:
For more information please do not hesitate and write to us.
Our address is agatka<--please remove it-->@.if.pw.edu.pl or fronczak<--please remove it-->@if.pw.edu.pl.
References:
[1]. Fronczak A. and Fronczak P., Origins of Taylor's power law for fluctuation scaling in complex systems, Phys. Rev. E, vol. 81(6), 2010